Changelog

Database queries, preview controls, safer deploys

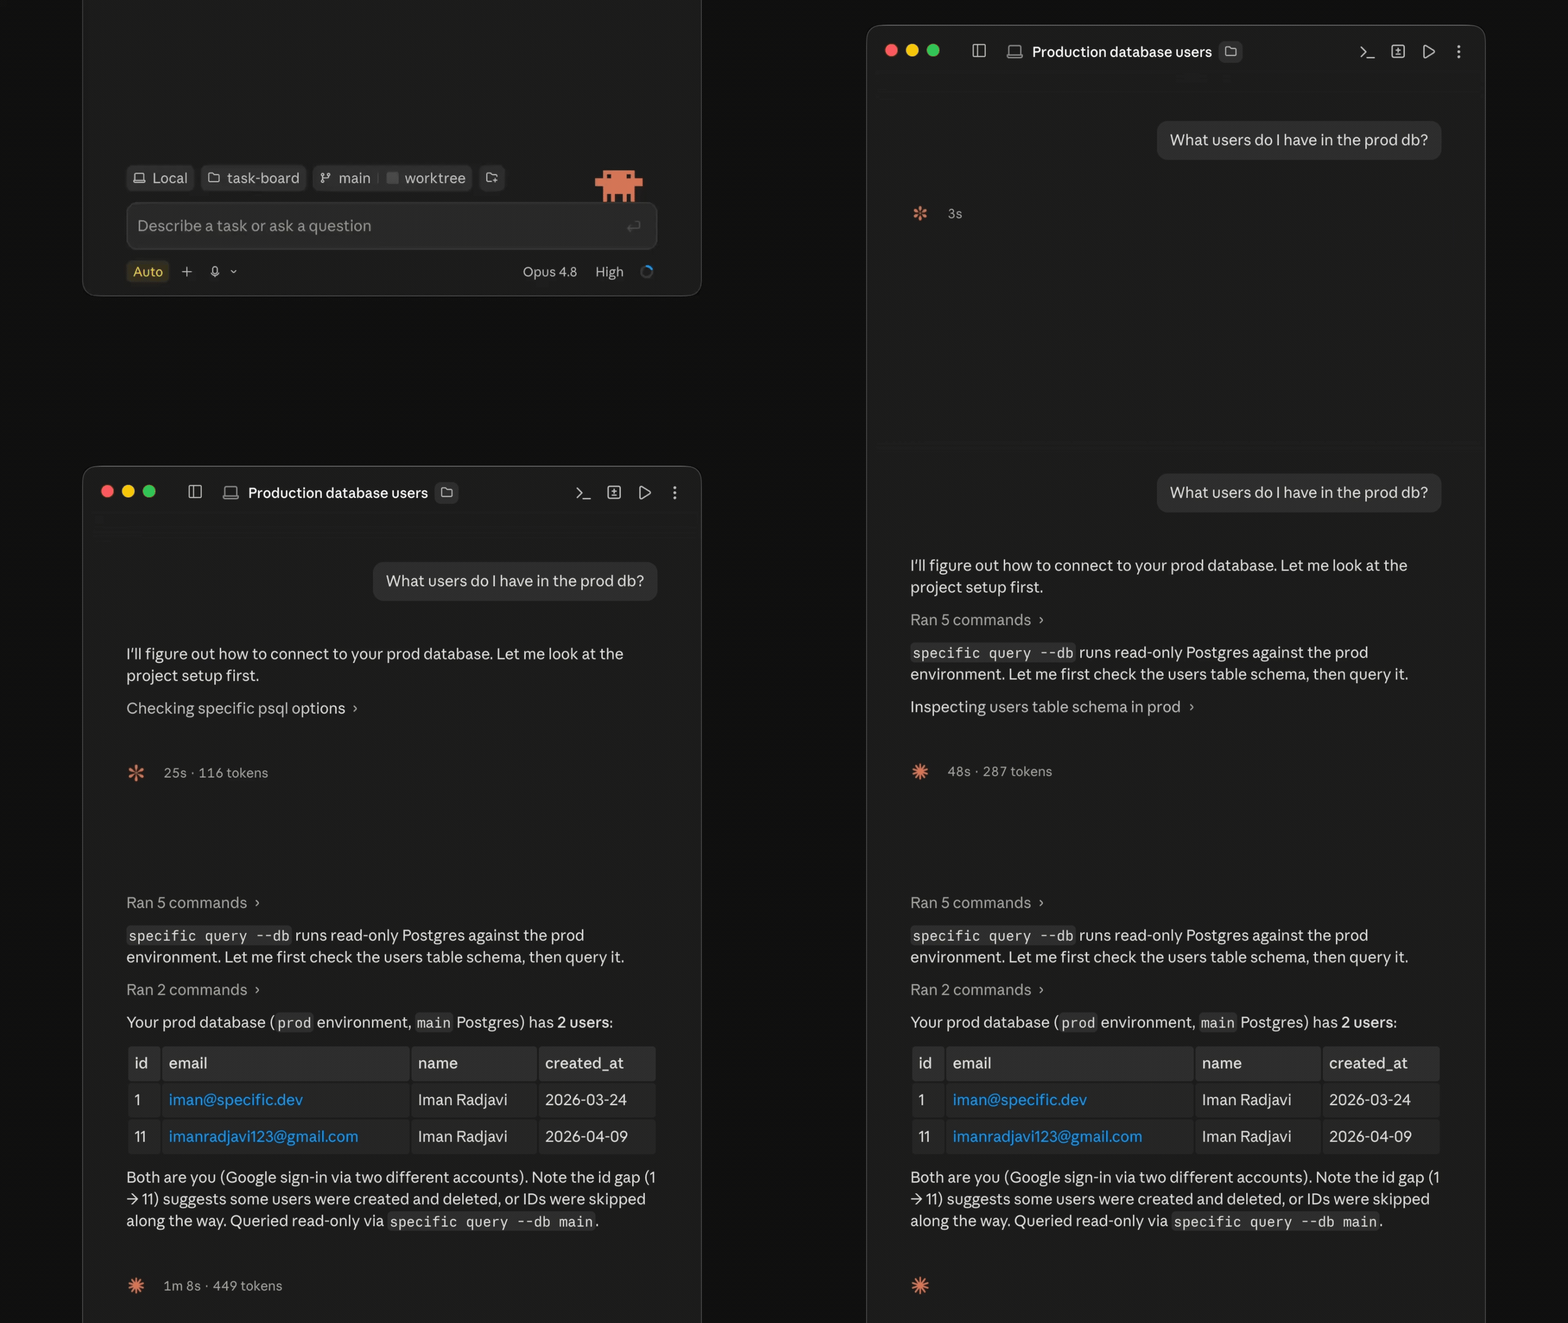
Coding agent querying a Specific Postgres database from the CLI

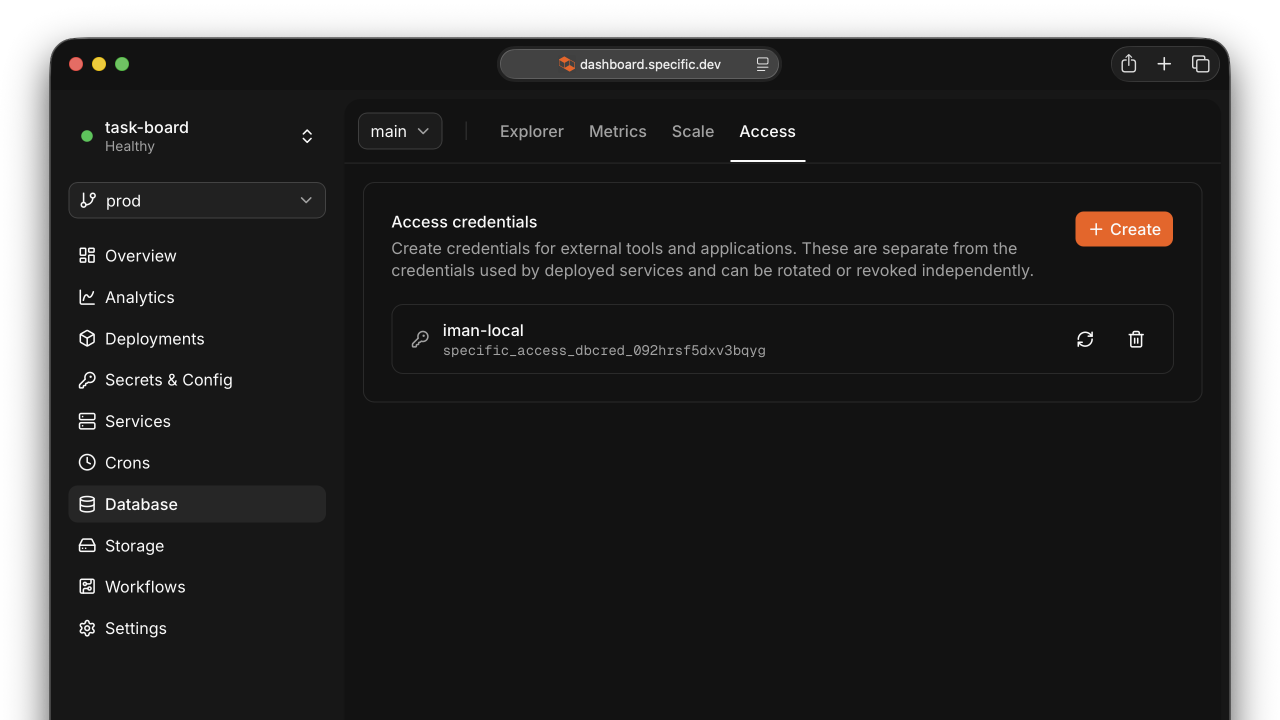
  • Your coding agent can now query your Specific Postgres databases from the CLI. With specific query --db <name>, it can inspect live data while debugging. Database queries are read-only, so it cannot accidentally change production data.
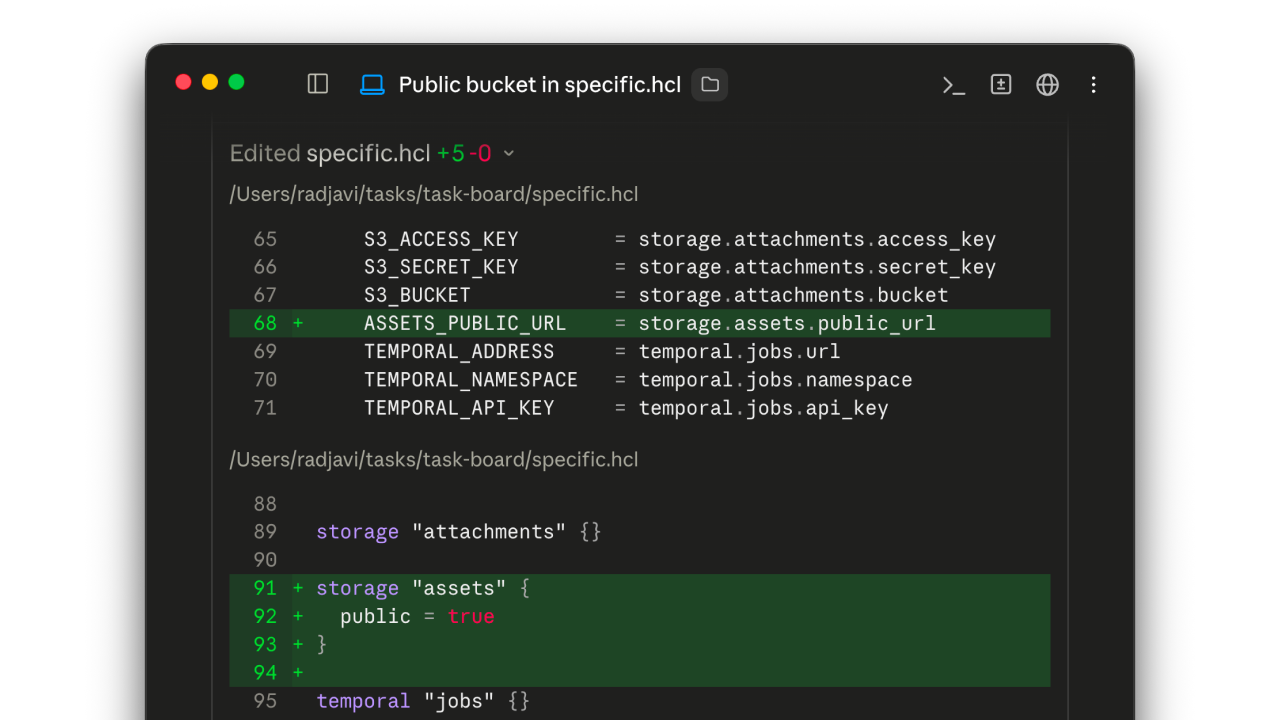
  • Preview environments can now use their own per-service compute sizes. Set the preview size from the dashboard before opening a preview deploy, so heavier services can get enough CPU and memory without scaling the base environment.
  • Preview volume clones can now run a reset command when they are created, so copied volumes can be prepared for preview testing before services start.
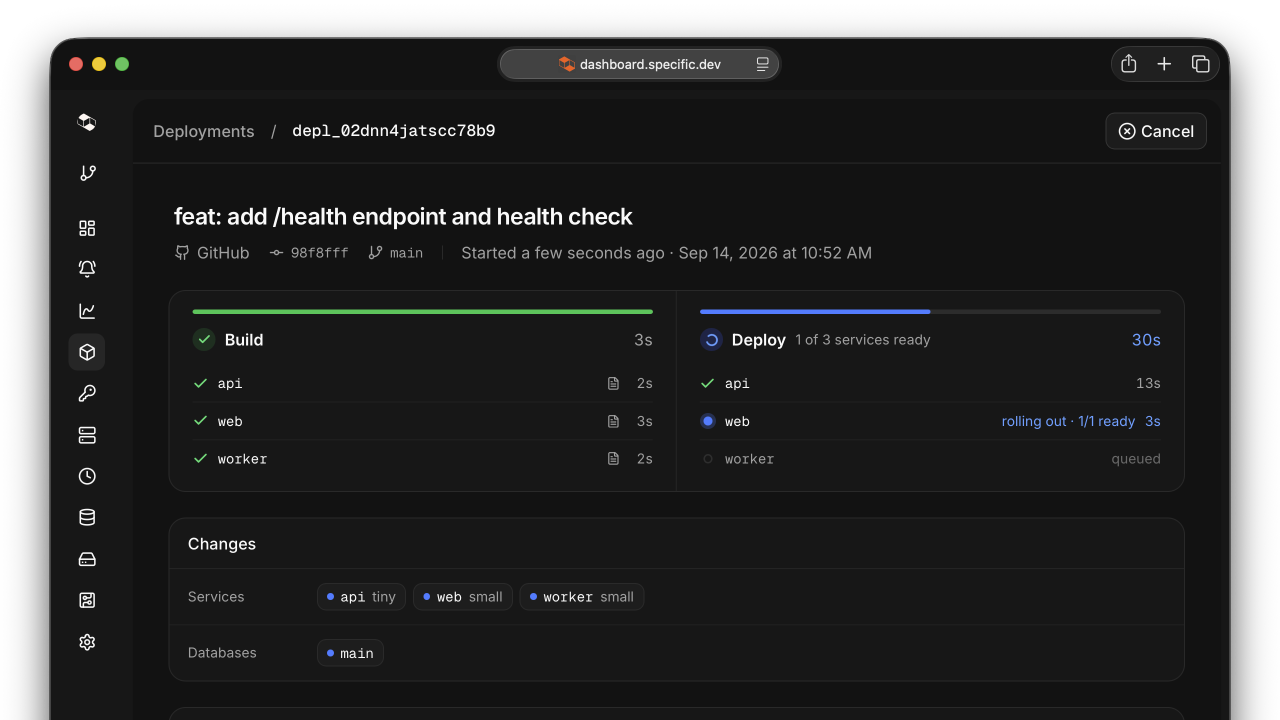
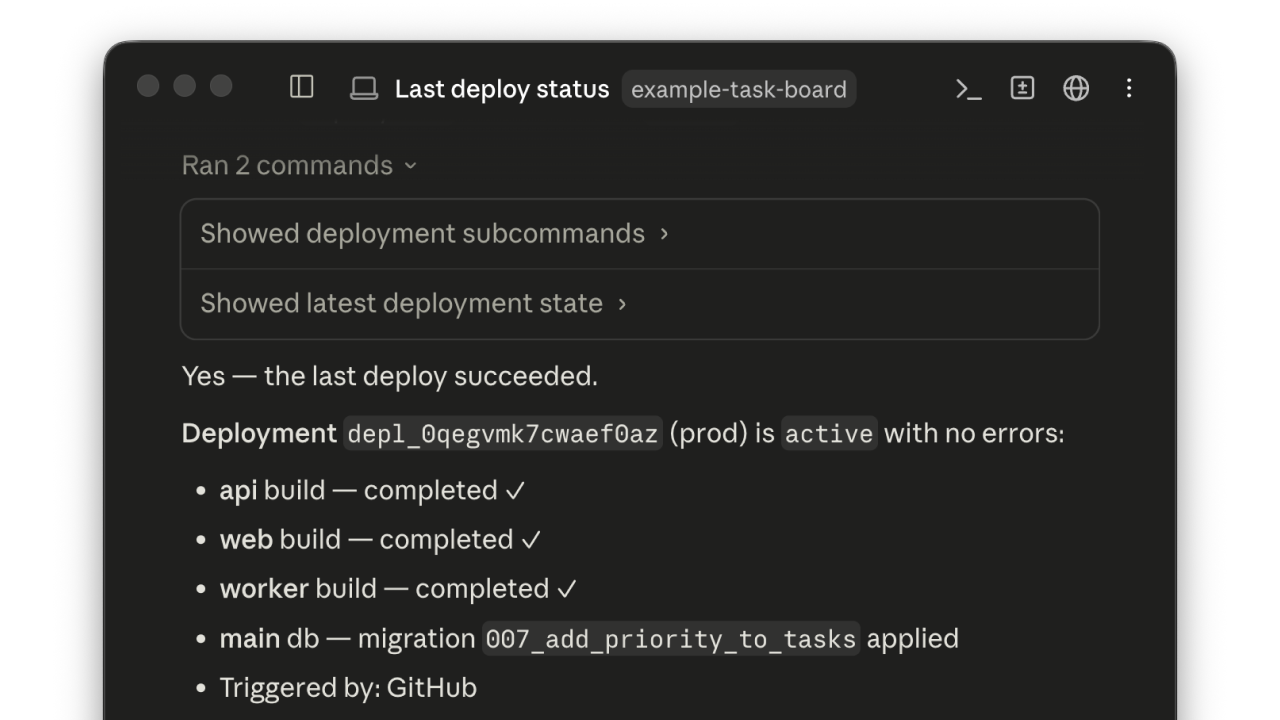
  • We shipped a round of deploy reliability improvements. Deployment history is easier to scan in the dashboard, unchanged volume-backed services avoid unnecessary redeploys, out-of-memory deploys now show a clearer error, and failed preview redeploys can be retried from the dashboard.

Service console and preview environments

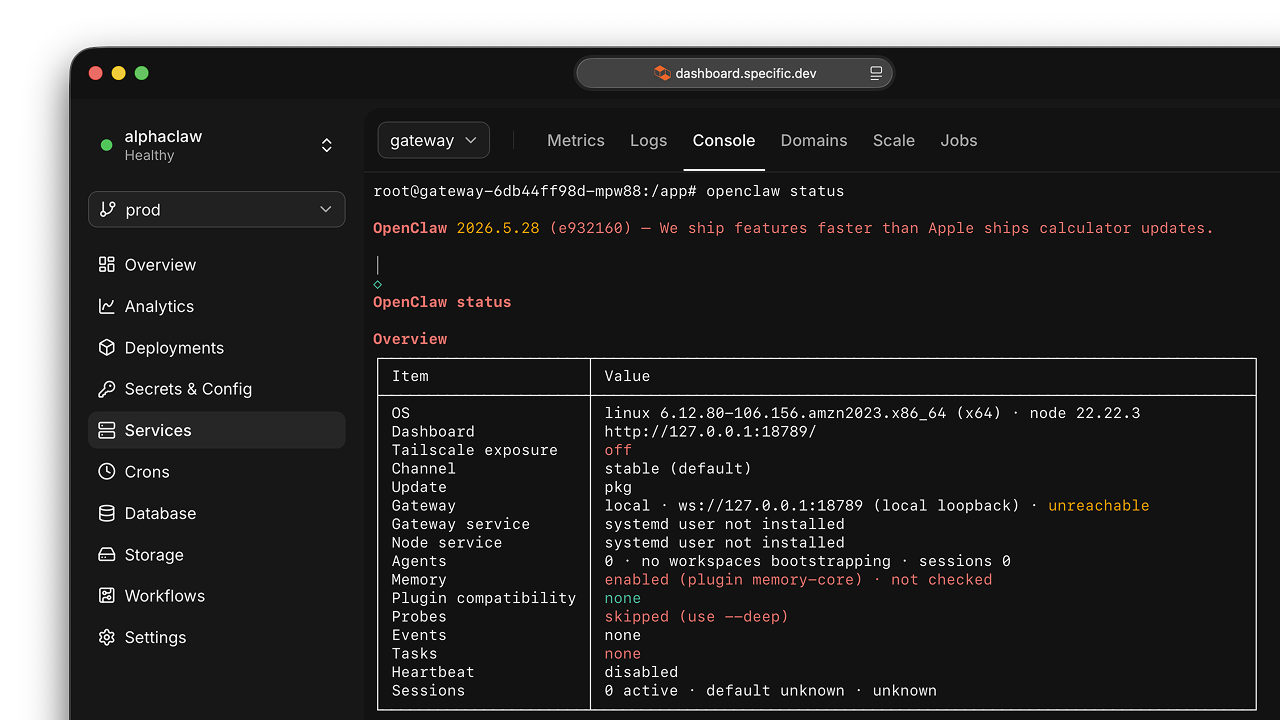
Service console in the Specific dashboard

  • You can now open a console for any running service from the dashboard. Pick a running instance and get an interactive shell without leaving Specific, which makes it easier to inspect containers, run one-off commands, and debug deploys.
  • Preview environments now use copy-on-write clones of your service volumes, so disk-backed state like uploaded files is available for testing instead of starting empty.
  • Preview environments are easier to debug from the CLI. specific status now lists preview environments with their URLs and IDs, and specific query --environment <name|id> can run the same log and metric queries against a preview deploy.

Scheduled jobs, one-click DNS, graph databases

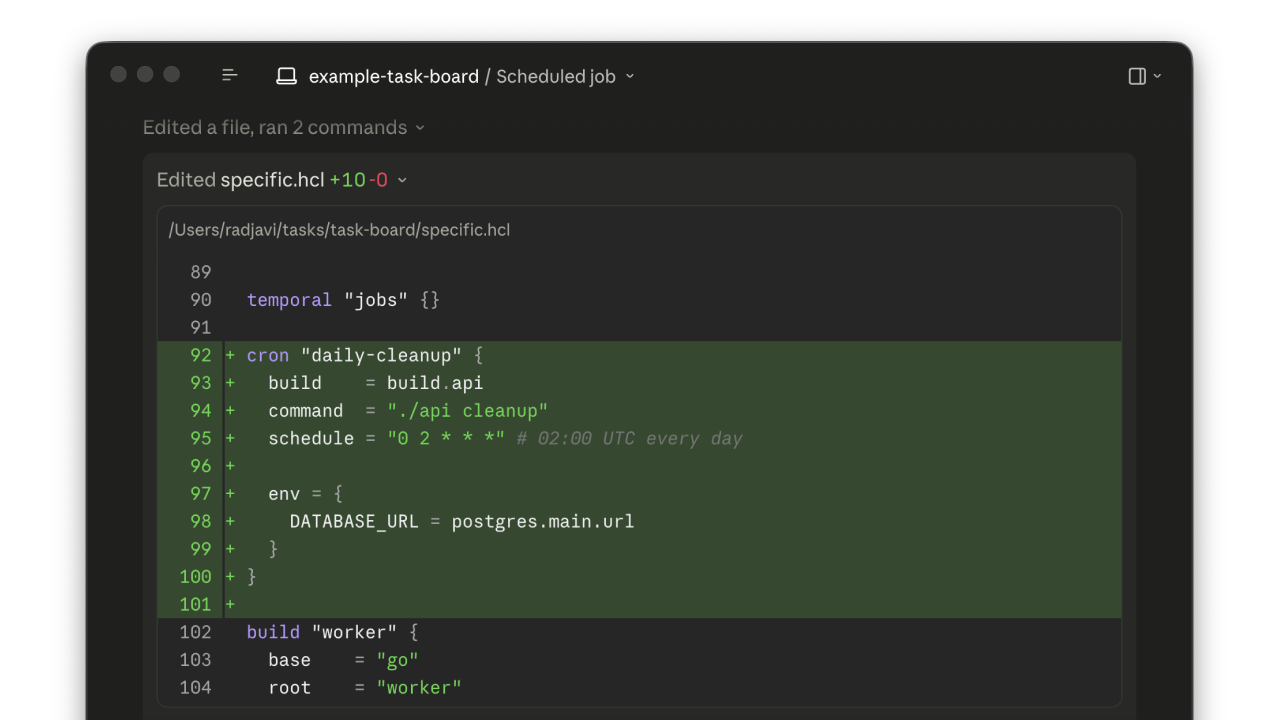
Scheduled job runs in the Specific dashboard

  • You can now define scheduled jobs in specific.hcl with cron blocks. Each run shows up in the dashboard with its own logs, CPU/memory metrics, and a Run now button.
  • Custom domains are easier to set up. When your DNS provider supports Domain Connect, the dashboard now opens a provider-hosted setup flow with the required record prefilled, while manual DNS instructions remain available for everyone else.
  • Specific Postgres now supports ltree and pgrouting in local development and production, so apps that need hierarchies, routing, and network queries can use the same extensions everywhere.

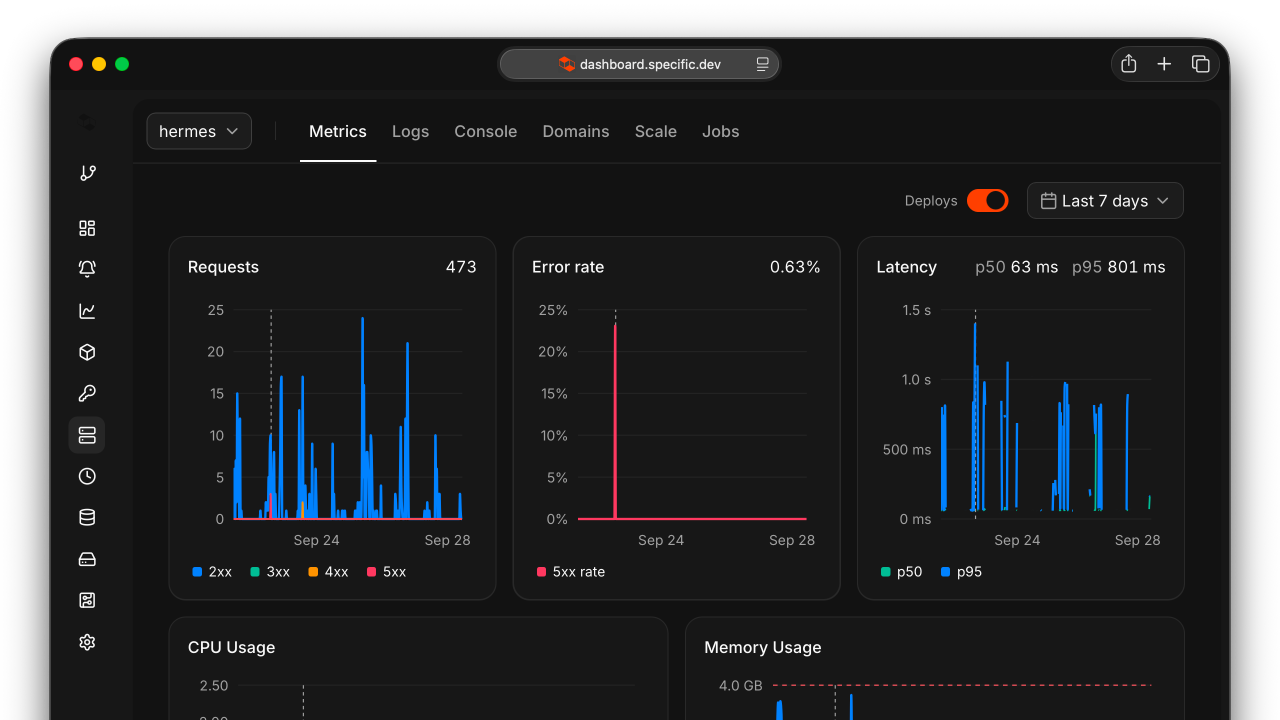
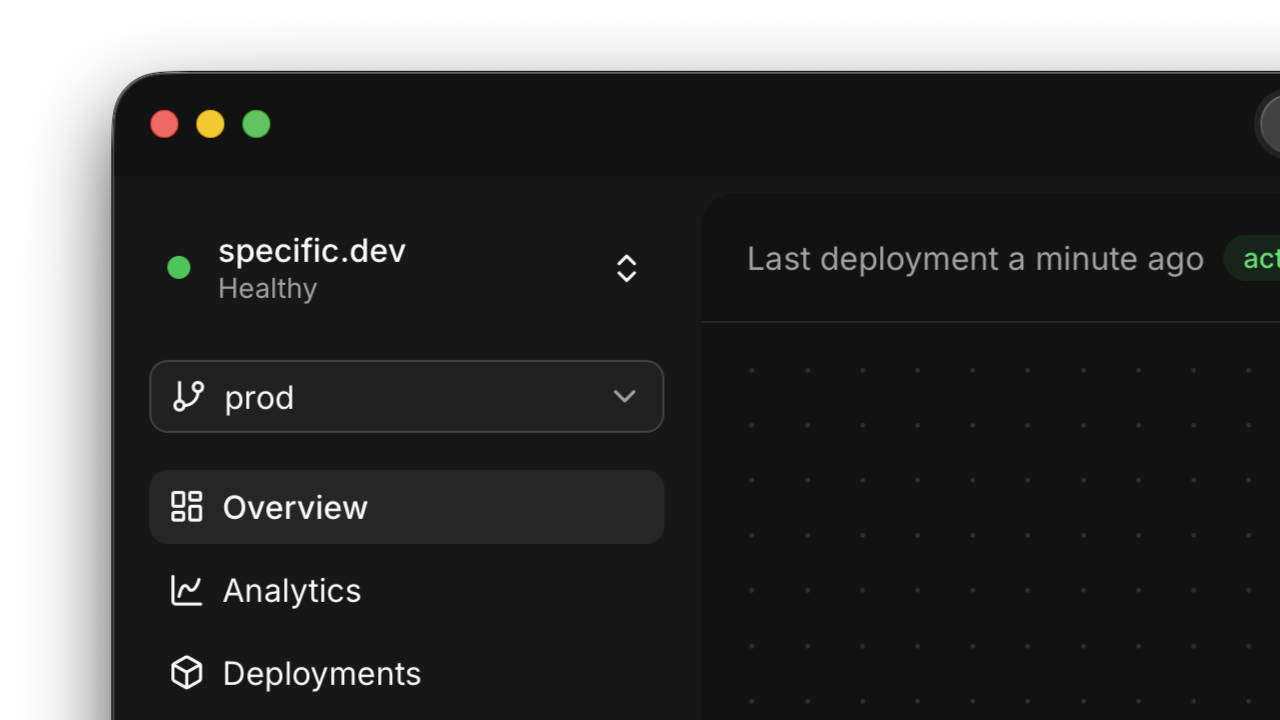
Project health in the dashboard

specific health check

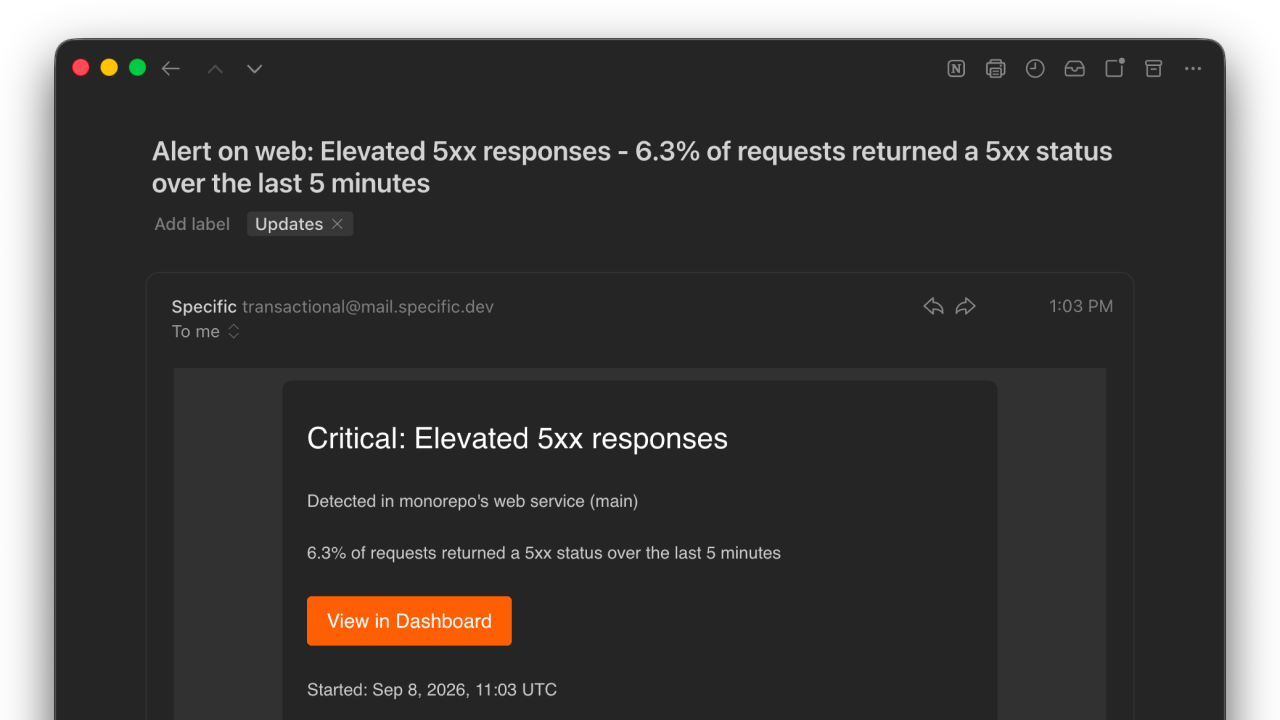
  • The dashboard now flags unhealthy projects in the sidebar. Open the health indicator to see recent service issues across your environments and jump straight to the affected service.

Let your agent debug production

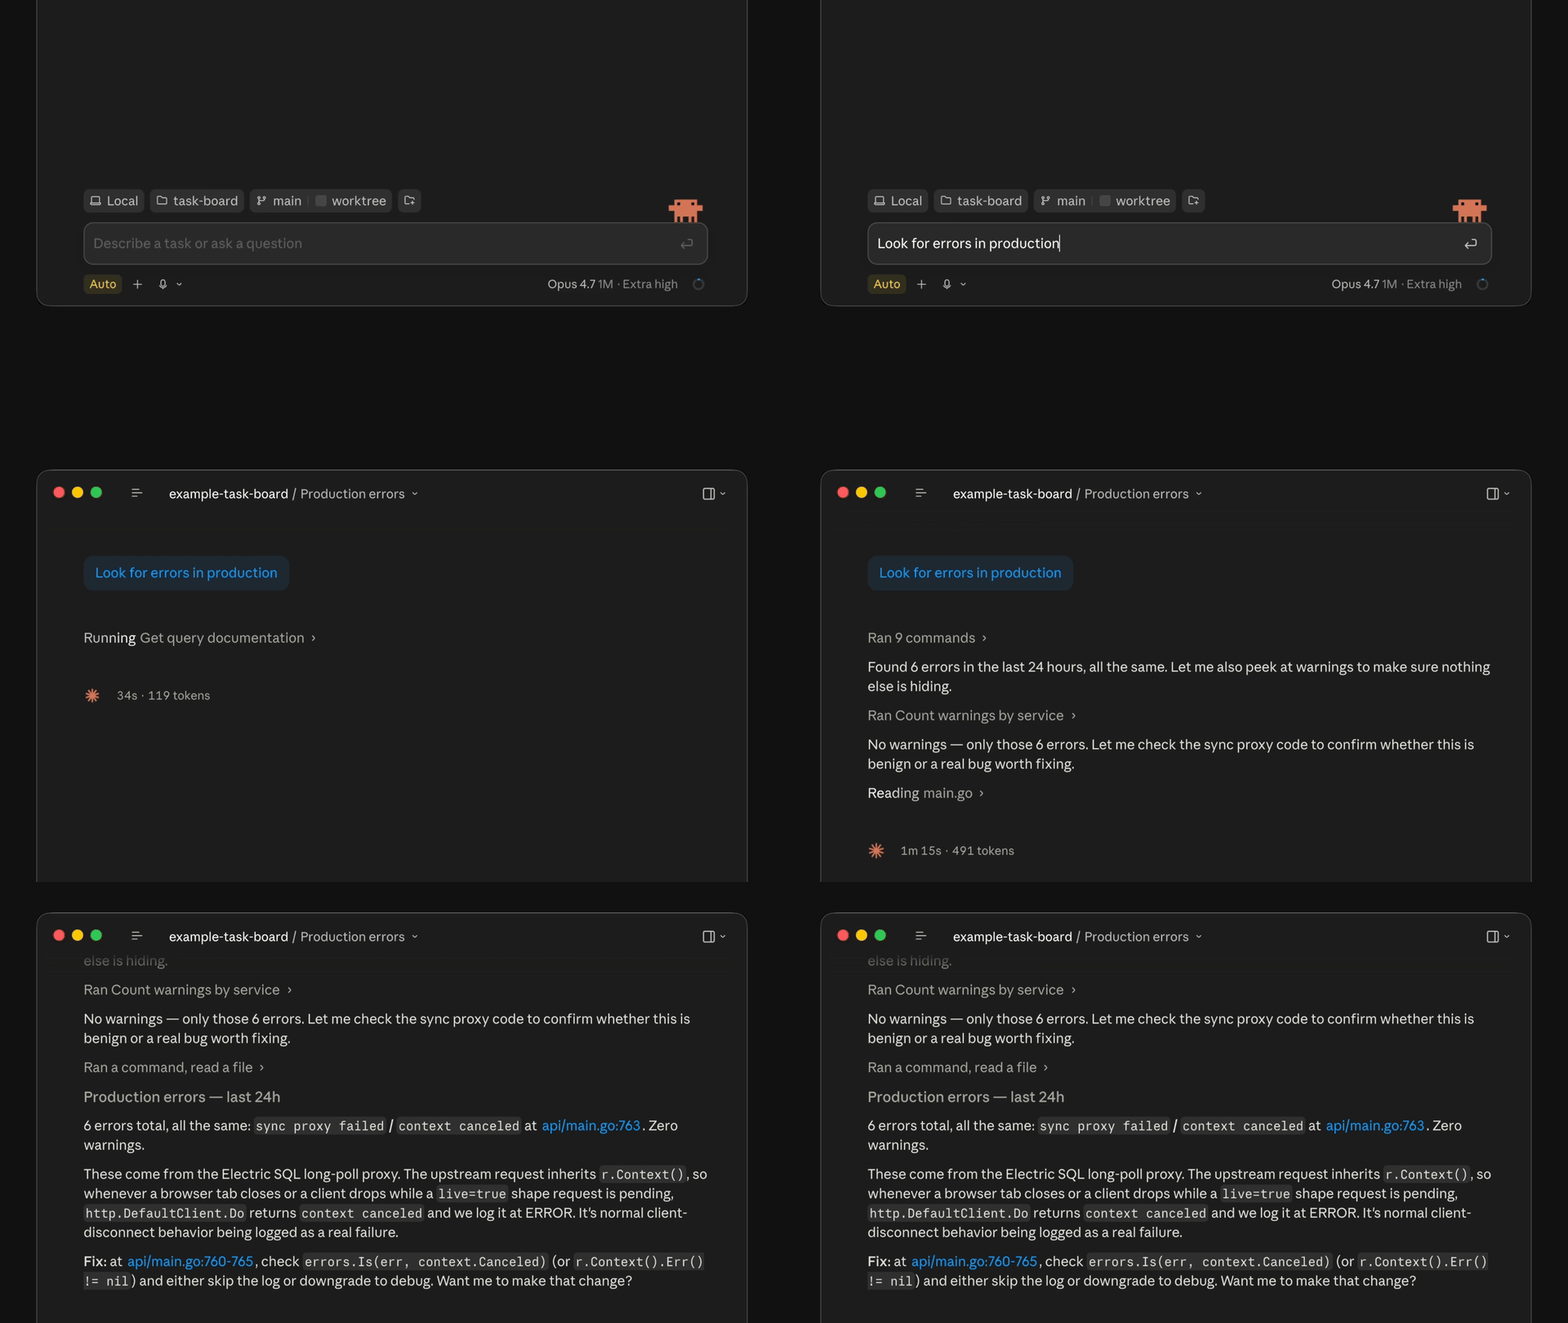
specific query demo

  • Your coding agent can now debug your production apps. With the new command specific query, your agent can fire ad-hoc SQL against your live logs, traces, and runtime metrics.

Health checks, faster deploys, volume metrics

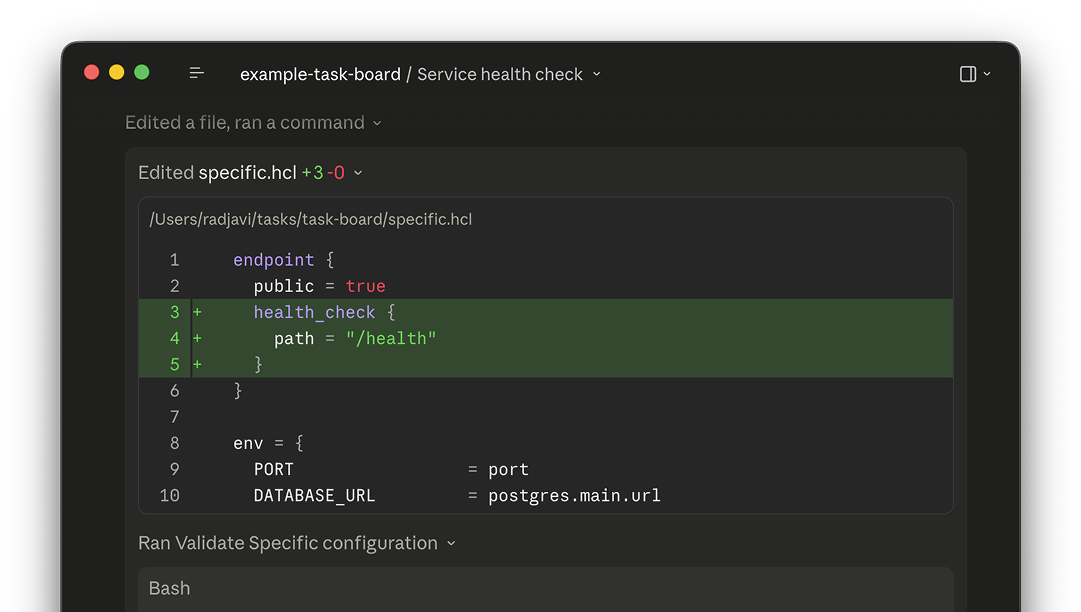
health check configuration

  • Your coding agent can now configure health check endpoints in specific.hcl, which we will use to ensure your deployments don't break anything.
  • Service pages now show a volume usage chart, so you can tell at a glance how much storage you're using.
  • Environments can now be renamed from settings.
  • Deployment uploads are now noticeably faster, in particular for large projects.
  • You can now gate PR preview environments behind a GitHub label, in case you don't want one spun up for every PR.

Custom domains for everyone

  • It's now possible to configure custom domains through the CLI, which means your coding agent can handle it for you.
  • We bundled TimescaleDB into our managed Postgres, improving support for scalable timeseries use cases.

Deployment visibility

  • The deployment list now shows the source (git, CLI, or PR) and total duration of each deploy at a glance.
  • Deployment detail pages have live build and deploy timers, so you can watch the seconds tick by.

Storage in the local dashboard

  • When you run specific dev, the local dashboard now has a storage explorer where you can browse the buckets in your local environment.

Command palette & logs

  • Hit ⌘K anywhere in the dashboard to open a command palette and jump to anything with your keyboard.
  • When you run specific dev, the local dashboard now has a log viewer.

Settings, billing, and protected environments

  • We added a "Usage" section to the organization settings which breaks down your usage over time.
  • We added a feature that lets you mark an environment as "protected", which means we will automatically enforce authentication for it without any updates to the code. Perfect for internal apps.
  • You can now configure automatic onboarding for your organization, so new teammates are automatically added without manual invites.

Deployment status

  • Run specific status to get details on the current state of your project in production.

Jobs & workflow controls

  • Use the new Jobs primitive to run one-off commands against any service. Great for one-off scripts and backfills.
  • You can now trigger Temporal workflows manually from the dashboard.
  • You can also terminate a running workflow from the UI, and the timeline view got clearer too.
  • The pg_trgm extension is now available in our bundled dev Postgres.

Ephemeral preview environments

  • We added support for preview environments. Enable it through the dashboard and we will spin up a copy of your infra for each pull request, including a full copy of your databases and storage.
  • You can also run specific deploy --preview from your own computer to get an ephemeral testing environment spun up.

Multi-environment & horizontal scaling

  • Services are now multi-environment-aware, so you can promote a deployment from staging to prod with one click. When you create a new environment, we copy over the secrets and config from a source environment so you don't have to.
  • Environments can now also be deleted
  • Services can now scale horizontally automatically based on load. Open your service in the dashboard and go to "Scale" to configure.

Invites, volume scaling, and a blog

  • You can now resize persistent volumes from the service scale tab.

Deployment metadata

  • Every deployment now tracks its git commit, branch, and source (git push, CLI, or PR), and shows them in the dashboard.

Temporal workflows, billing upgrades, get-started flow

  • We added a Temporal workflow inspector to the dashboard. You can view workflow runs and dive into the details with a split-panel view.
  • The log viewer got severity indicators, JSON parsing, and clickable rows that expand to show full details.

Built for coding agents

  • The specific CLI has been overhauled so that an agent can use it end-to-end. This means you can ask your agent to build something and it will autonomously sign in, spin up a local environment to test, and finally deploy the project to production.

Postgres extensions

  • Our managed Postgres now supports pgvector for vector embeddings.
  • Postgres now includes ICU collation support, so text sorting and search work better across languages.

Teams

  • Organizations now support multiple users. Invite teammates and collaborate on projects by clicking the project switcher in the top-left and then "Organization settings".

Container images & dashboard polish

  • You can now deploy a service from a pre-built container image, not just from source.
  • Builds support a custom Dockerfile if you need fine-grained control.
  • You can view the raw version of your specific.hcl directly from the dashboard.

Persistent volumes

  • You can now attach persistent volumes to your services for stateful workloads, like OpenClaw or databases.

A new tunnel server

  • We rebuilt our tunneling server, so specific dev --tunnel now serves your services snappier and more reliable.

String interpolation in HCL

  • specific.hcl now supports string interpolation, so you can reference other resources inline without annoying workarounds.